Voteless Majority
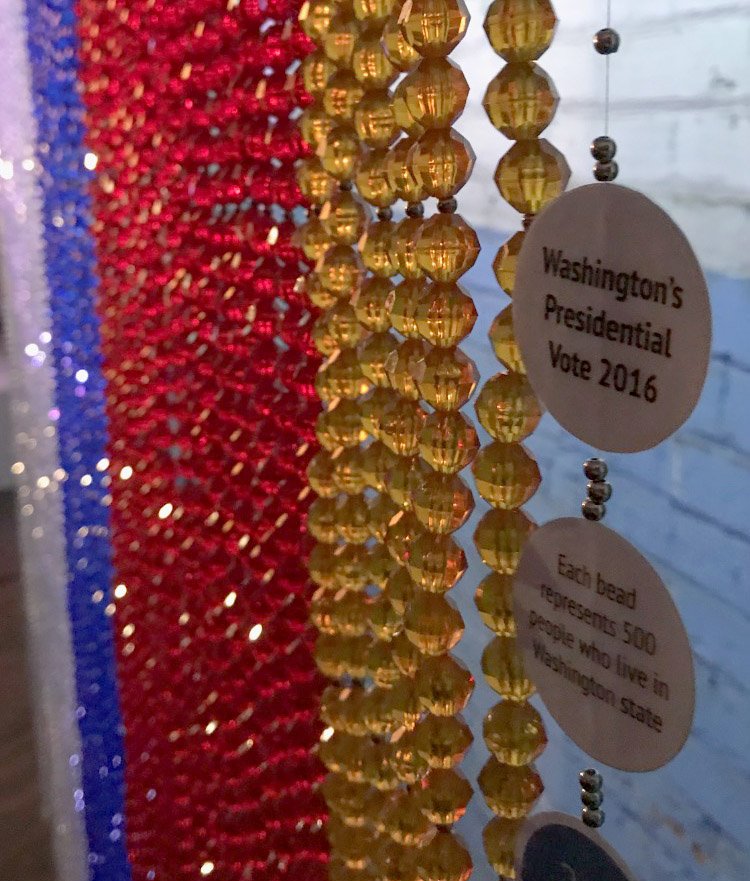
Washington’s vote in the 2016 presidential election as data art
Maps and charts showing election results are among the most commonly produced and widely seen forms of data visualization in journalism. Most news industry visualization of election data focuses on vote counts to report which candidate has won an election and by what margin.
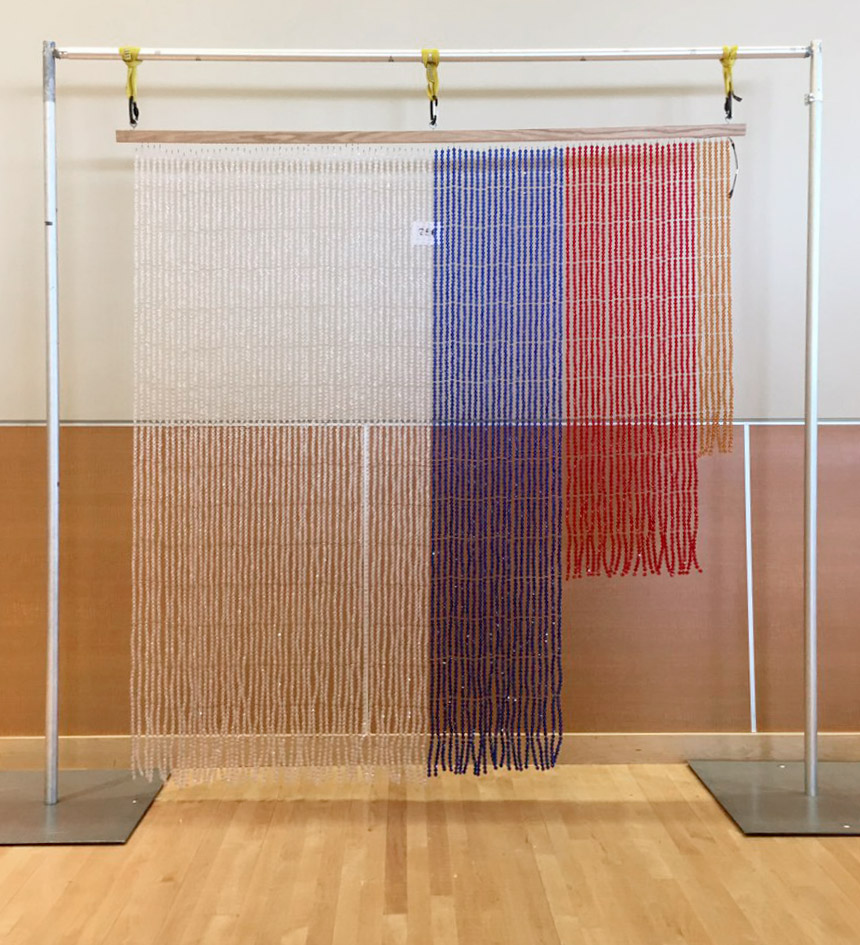
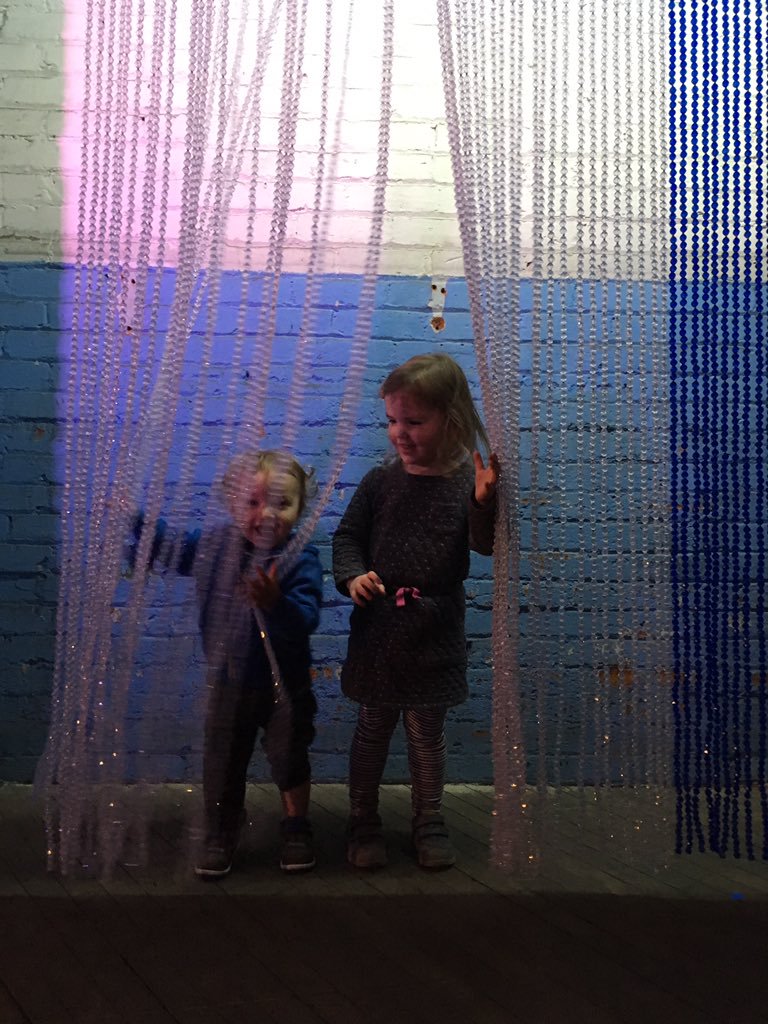
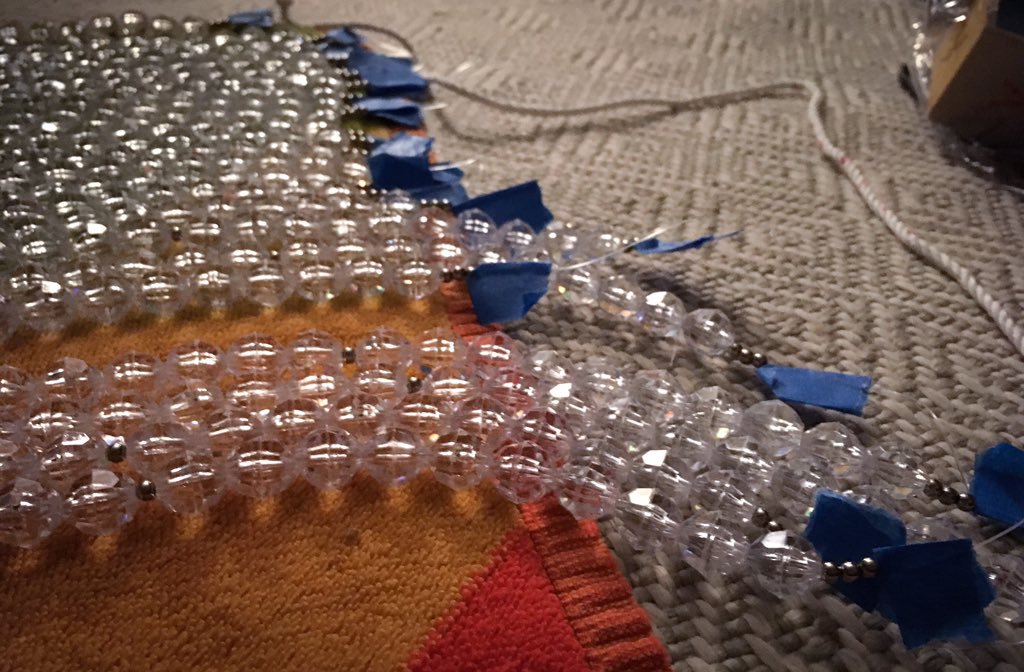
This work of data art makes use of the same election data, but puts the focus on people, rather than votes, and challenges the common understanding of "majority" in a democracy. It visualizes how the people of Washington voted in the 2016 presidential election, with each bead representing 500 people. People who did not or could not vote outnumber those who voted. Unlike news graphics intended to inform, this tactile visualization is intended to invite inquiry and contemplation about the conflation of election results and the "will of the people."
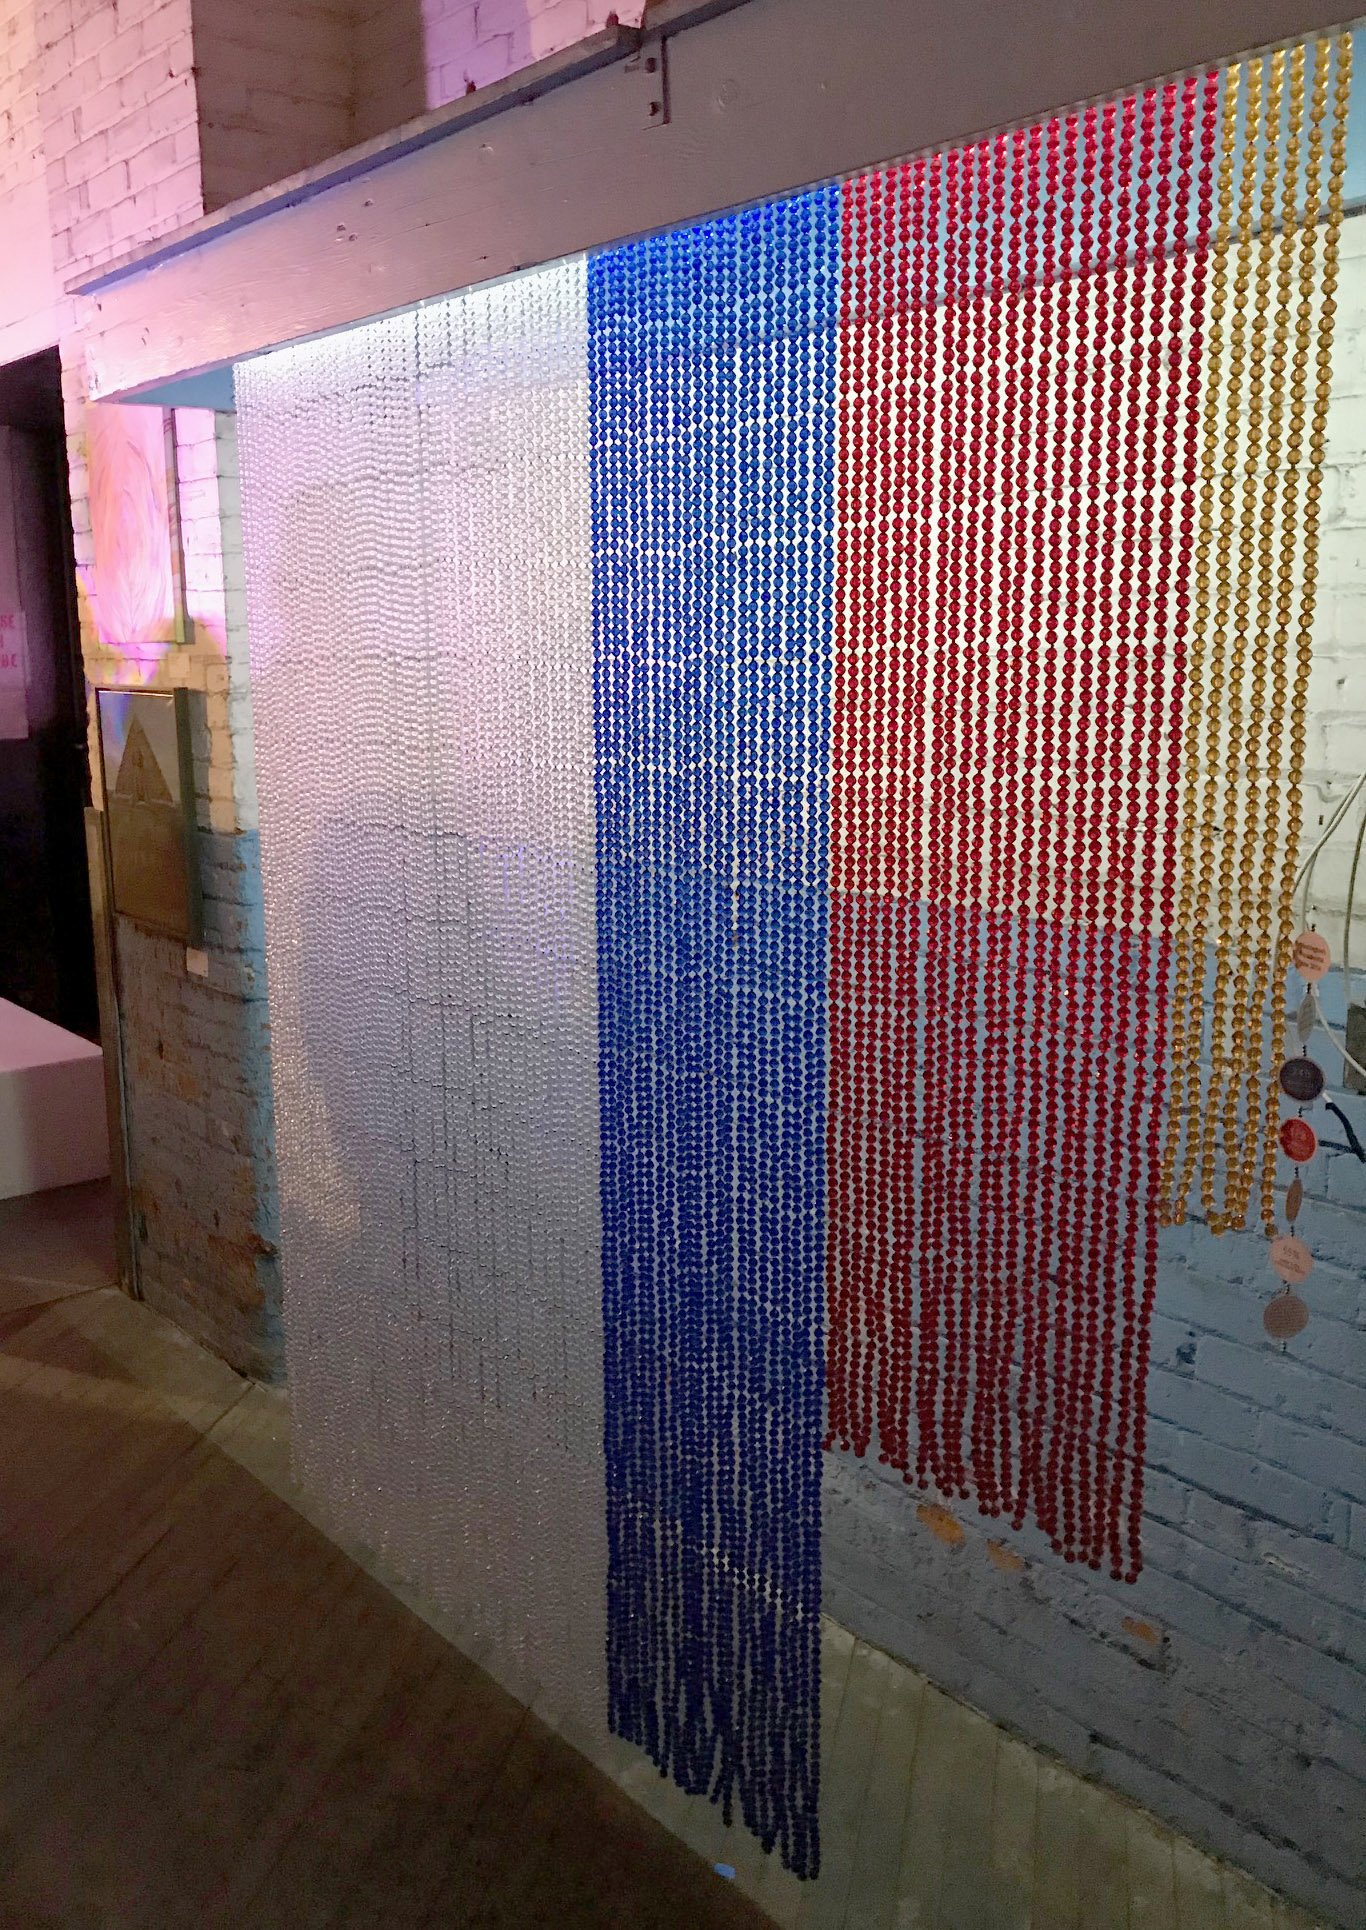
The completed work was displayed at the juried Terrain art show in Spokane in October 2018.
Academic Showcase, Washington State University, March 2019
Terrain, Spokane, Washington, Oct. 2018
Materials
The bead curtain is made with 14,367 acrylic beads, plus silver spacers. The beads were strung by hand on nylon filament, which was affixed to a wooden bar. The total size is 6.5x7 feet.
Data
The 2016 vote data is from the Washington Secretary of State (www.sos.wa.gov/elections). The population data is from the state Office of Financial Management postcensal estimate for 2016.
Key
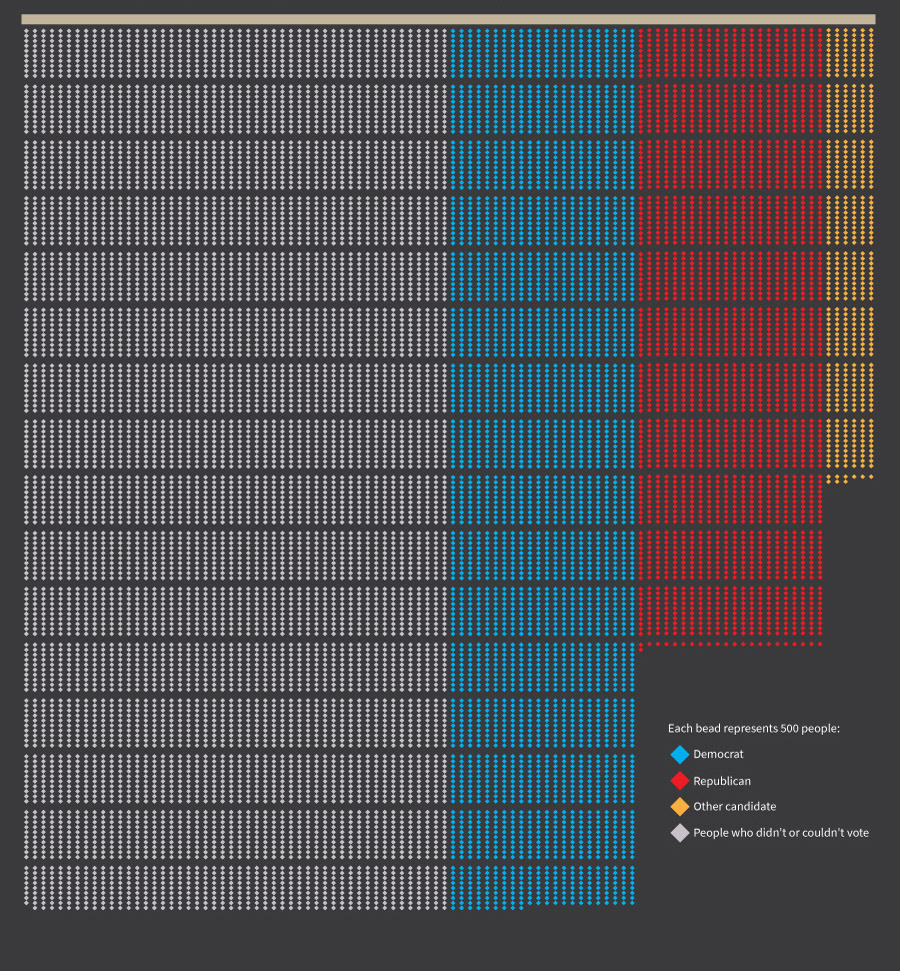
Each bead represents 500 people who live in Washington state.
Of those who voted in Washington state in the 2016 presidential election, 54% voted Democrat (blue beads), 38% voted Republican (red), and 8% voted for other candidates (gold).
Clear beads represent eligible voters who didn't vote and those who can't vote: minors, some convicted felons, people deemed mentally incompetent, and noncitizens.